Rui-xue Zhong1,
Guang-fu Feng1,
Yu-jie Liu2,
Lian Zhong2,
Chun-jie Wu2,
Jun Wan3 ![]()
For correspondence:- Jun Wan Email: wanjuntcm@163.com Tel:+8613980561562
Received: 18 January 2016 Accepted: 6 June 2016 Published: 31 July 2016
Citation: Zhong R, Feng G, Liu Y, Zhong L, Wu C, Wan J. Origin discrimination and quality evaluation of Gastrodiae rhizoma (Orchidaceae) by high-performance liquid chromatographic fingerprint. Trop J Pharm Res 2016; 15(7):1535-1541 doi: 10.4314/tjpr.v15i7.25
© 2016 The authors.
This is an Open Access article that uses a funding model which does not charge readers or their institutions for access and distributed under the terms of the Creative Commons Attribution License (http://creativecommons.org/licenses/by/4.0) and the Budapest Open Access Initiative (http://www.budapestopenaccessinitiative.org/read), which permit unrestricted use, distribution, and reproduction in any medium, provided the original work is properly credited..
Purpose: To develop a high-performance liquid chromatography (HPLC) fingerprint method for the quality control and origin discrimination of Gastrodiae rhizoma.
Methods: Twelve batches of G. rhizoma collected from Sichuan, Guizhou and Shanxi provinces in china were used to establish the fingerprint. The chromatographic peak (gastrodin) was taken as the reference peak, and all sample separation was performed on a Agilent C18 (250 mm×4.6 mmx5 μm) column with a column temperature of 25 °C. The mobile phase was acetonitrile/0.8 % phosphate water solution (in a gradient elution mode) and the flow rate of 1 mL/min. The detection wavelength was 270 nm. The method was validated as per the guidelines of Chinese Pharmacopoeia.
Results: The chromatograms of the samples showed 11 common peaks, of which no. 4 was identified as that of Gastrodin. Data for the samples were analyzed statistically using similarity analysis and hierarchical cluster analysis (HCA). The similarity index between reference chromatogram and samples’ chromatograms were all > 0.80. The similarity index of G. rhizoma from Guizhou, Shanxi and Sichuan is evident as follows: 0.854 - 0.885, 0.915 - 0.930 and 0.820 - 0.848, respectively. The samples could be divided into three clusters at a rescaled distance of 7.5: S1 - S4 as cluster 1; S5 - S8 cluster 2, and others grouped into cluster 3.
Conclusion: The findings indicate that HPLC fingerprinting technology is appropriate for quality control and origin discrimination of G. rhizoma.
Introduction
Gastrodiae rhizoma (Tianma in Chinese), the dry tuber of Gastrodia elata Blume, is a common-used and extraordinary TCM listed in the Chinese Pharmacopoeia 2015 edition [1]. In Han Dynasty, it’s typically recorded as a high quality drug in Shen-nung-pen-tsao-ching to treat headache, anticonvulsant, paralysis, epilepsy and tetanus [2,3]. The G. rhizoma was mainly planted in Sichuan, Guizhou and Shanxi, etc. in China.
As a precious and commonly used medicinal material, the quality control of G. rhizoma is greatly necessary. Though some quality control methods were established, previous investigations on quality control of G. rhizoma mostly focused on determination of single or several major compounds [4,5].
In addition, different origin area and growing conditions may cause significant differences in chemical patterns and quality of G. rhizoma [6,7]. However, it is very difficult to divide G. rhizoma from different areas in appearance. Therefore, it is important to develop a method for better quality control and the origin discrimination of G. rhizoma.
High-performance liquid chromatography (HPLC) fingerprinting technology is proved to be a useful tool for qualitative and quantitative analysis in TCM, especially some unknown components in herbal drugs [8-10]. To obtain the meaningful correlations from HPLC fingerprint, statistical analysis based on the samples’ data are usually required, and similarity analysis and hierarchical cluster analysis (HCA) are the most popular statistical methods [11,12].
In the present study, HPLC was used to establish the chromatographic fingerprint for quality control and origin discrimination of G. rhizoma by combining the chemometric methods including similarity evaluation and HCA.
Methods
Chemicals and reagents
Gastrodin (Batch No.110807-200205) was purchased from National Institutes for Food and Drug Control (Beijing, China). Chromatographic-grade acetonitrile and methanol were all purchased from Fisher Chemicals (Fisher lawn, New Jersey, USA). The water used in the experiment was made by the Millipore purification system (Millipore, MA, USA). All the other reagents used in the experiment were of analytical grade.
Sample preparation
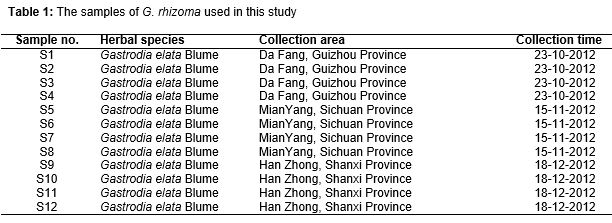
G. rhizoma were collected from Sichuan, Guizhou, Shanxi, and identified by Professor Liang-ke Song in South-west Jiao-tong University. Then, the samples were pulverized into powder and sifted through the standard 50-mesh sieve (355 ± 13 μm). The information on the samples are listed in .
The 12 pulverized samples of G. rhizoma were accurately weighed (approximately 4.0 g) and the samples were extracted by reflux for 1 h in 50 mL of methanol. Then, the extracted solutions were filtered through a 0.22 μm filtration membrane, and the injection volume was 10 μL. Gastrodin standard was dissolved with methanol as the standard solution.
HPLC chromatographic conditions
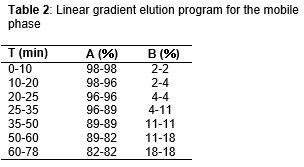
HPLC was performed using an Agilent 1200 high performance liquid chromatography system (Agilent Technologies, CA, USA). The separation of samples was performed on an Agilent C18 (250 mm×4.6 mm, 5 μm, Agilent Company) column. The mobile phase consisted of (A) phosphate acid/water (0.4:100, v/v) and (B) acetonitrile. The most suitable linear gradient elution program was shown in . The flow rate was 1.0 mL/min, and the temperature of the chromatographic column was maintained at 25 °C. The wavelength selected for our experiment was 270 nm.
Data analysis
Similarity analysis was performed by using the Similarity Evaluation System for Chromatographic Fingerprint of Traditional Chinese Medicine (Version 2004A), which is recommended by Chinese Pharmacopoeia Commission. The hierarchical cluster analysis of samples was performed by SPSS software (SPSS for Windows 17.0, SPSS Inc., USA).
Results
Optimized chromatographic conditions
In this study, the mobile phase was investigated on the chromatographic separation of the samples. The different mobile phase compositions were as follows: acetonitrile-phosphoric acid/water (0.1:100, v/v), acetonitrile-phosphoric acid/water (0.4:100, v/v), methanol-phosphoric acid/water (0.1:100, v/v), methanol-phosphoric acid/water (0.4:100, v/v). As a result, the acetonitrile-phosphoric acid/water (0.4:100, v/v) was selected as an appropriate mobile phase with best resolution and shortest analysis time. Selection of an appropriate detection wavelength plays an important role to ensure precise detection of some essential constituents and to achieve more peaks. Diode Array Detector was used in the present study, and full scan runs were made initially to select the optimum wavelength that provided the best results in chromatographic fingerprinting analysis. The chromatogram obtained at 270 nm showed the steadiest baseline and the most abundant components information comparing with the other wavelengths. As a result, 270 nm was chosen as the monitoring wavelength.
Optimized of extracting conditions
Extraction solvent
The samples were subjected to reflux extraction with ethanol, water and methanol, respectively. The results showed that methanol extract had more number of peaks than other solvent. Finally, methanol was finally chosen as the optimal extracting solvent.
Extraction method
With methanol as the extraction solvent, the samples were extracted by reflux and by ultrasonic in comparison. According to the results of two methods, the more peaks were obtained from reflux extraction. Consequently, the reflux extraction was chosen as extracting method for the samples.
Validation
The method was validated as per the guideline of Chinese Pharmacopoeia [13].The injection precision was determined through replicating the same sample solution and continually injected six times per day. The sample stability was determined by taking one sample solution kept at room temperature for 0, 4, 8, 12, 18 and 24 h. The repeatability of this test was estimated by analyzing six separate extract solutions of one sample. In terms of injection precision, the relative standard deviation (RSD) of RRT and RPA were below 0.95 and 2.83 %, respectively; In terms of sample stability, the RSD values were found not to exceed 1.45 and 2.88 %, respectively; In terms of repeatability, the RSD values were less than 0.66% and 2.86 %, respectively. Therefore, all the results indicate that the established method is stable and under control.
HPLC fingerprint
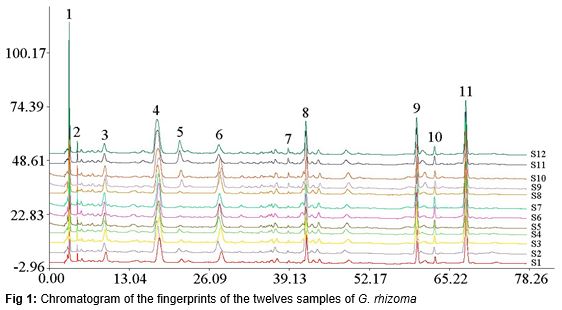
The chromatograms of the twelves samples were recorded in 78 minutes, which were shown in . According to the results of HPLC fingerprint, 11 common peaks were found. Among the characteristic peaks, peak No. 4 at retention time of 17.56 minutes was identified as Gastrodin compared with the Gastrodin standard, and it was designated as the reference peak. Because it appears with a stable time and a large area in the chromatogram, the RSD value is below 3.0 %. Also its comparative standing time of common peaks approximately fits the requirements.
Gastrodin is one of the main active components in G. rhizoma, featuring with broad pharmacological activity, sedative, anticonvulsant actions [14]. It is often prescribed to treat vertigo, paralysis, hemiplegia and rheumatism diseases. Thus, as an object of reference, Gastrodin can be used in the identification and quality evaluation of G. rhizoma.
Relative peak area and similarity of the samples
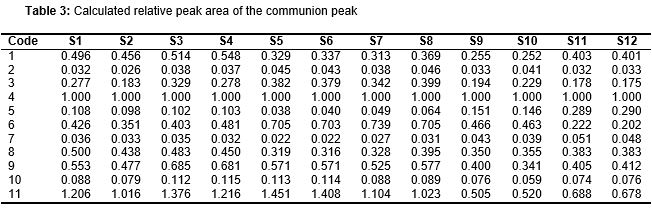
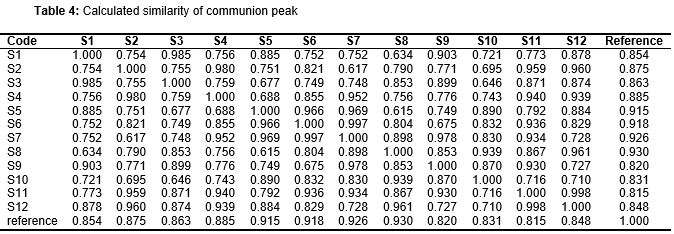
The chromatograms of twelves sample were recorded at 270 nm and the chromatographic peaks in twelves samples with the same relative retention time were defined as the characteristic peaks. Eleven peaks were identified as the characteristic peaks. Gastrodin was designated as the reference peak for the calculation of RPA. Moreover, the relative retention time (RRT) and relative retention area (RPA) of these 11 peaks in twelve samples were shown in . The data of the chromatographic fingerprints were analyzed by the Similarity Evaluation System for Chromatographic Fingerprint of Traditional Chinese Medicine (Version 2004 A) software (Chinese Pharmacopoeia Commission, Beijing, China). The reference chromatogram was generated by the median method and the similarity indexes of the twelves samples are listed in .
Similarity index
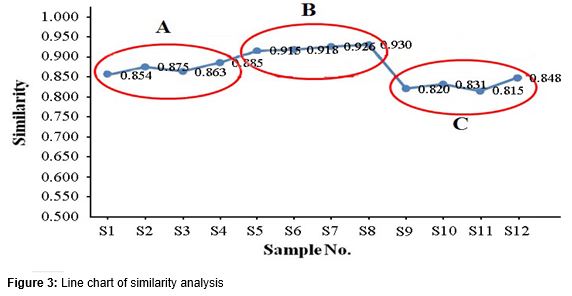
As shown in , compared with the reference chromatogram created via the median method, the similarity of the twelves samples gathered from three different provinces (Sichuan, Guizhou and Shanxi) in China were all above 0.80. The result demonstrated that each of the twelves G. rhizoma samples had a great similarity compared with the reference chromatogram. Therefore, the quality of twelves G. rhizoma samples from three different provinces(Sichuan, Guizhou and Shanxi)in China were similar. Nevertheless, we discovered some tiny differences between the samples from different province that the similarity of Guizhou, Shanxi, Sichuan samples were of 0.854 - 0.885, 0.915 - 0.930 and 0.820 - 0.848, respectively. In contrast, the similarities of samples from different province didn’t have a certain regularity.
The eleven characteristic peaks in chromatograms were the main components of G. rhizoma. These three provinces are main produced places of G. rhizoma in China, so the quality of three area can represent the average quality in China. As a result, for quality control of G. rhizoma in China, 0.800 was set as a fit value. That is to say, the samples of G. rhizoma have reliable quality when the similarity was above 0.800.
Hierarchical cluster
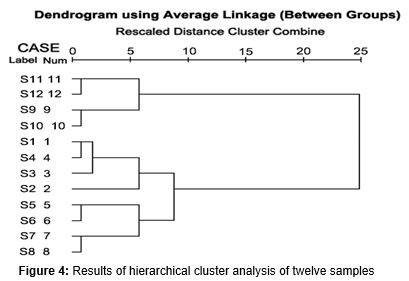
The RPA of 11 characteristic peaks of twelves samples were analyzed by the SPSS software. The distances among the twelve samples were calculated via the SPSS software, with the between-groups linkage as the cluster method and the squared Euclidean distance as the measure interval. The result of experiment suggested that the twelves samples could be divided into three clusters at the distance of 7.5: the samples of S1-S4 can be classified as cluster 1; the samples of S5-S8 can be formed as cluster 2; the others samples can be grouped into cluster 3. The relationships among the G. rhizoma samples collected from three different provinces in China is shown in the dendrogram which constructed according to HCA ().
From , the twelve samples were categorized into three groups based on HCA. The samples from cluster 1 (Guizhou) and cluster 2 (Shanxi) were of more similarity than the samples from cluster 3 (Sichuan). The classification results by HCA indicated that the sample from the same area had more similar chemical fingerprints and internal quality than others. The classification based on HCA was consistent with the similarity analysis results of G. rhizoma (Figures 3 and 4), and the results can mutually authenticate. The results can provide a new method for origin discrimination and quality evaluation of G. rhizoma.
Discussion
G. rhizoma, a precious herbal medicine of TCM, has been used for a long time in China to treat hypertension, reduce dizziness, improve circulation, and relieve headaches [15,16]. As the increasing consumption of G. rhizoma, its safety and quality are being increasingly concerned [17,18]. Therefore, it is urgent to develop a high efficacy method for the origin discrimination and quality control of G. rhizoma from different origins.
HPLC fingerprint is emerging as a viable technique for qualitative and quantitative analysis of natural products, and the applications in the analysis of TCM has been also reported in the literature [19-21]. Similarity analysis and HCA are popular methods in applied statistical work and data analysis, and they have a good ability to summarize multivariate variation. With their help, the relationship between the fingerprints and the origins of G. rhizoma was elucidated in the present study. Thus, an HPLC fingerprint method has been established for the evaluation and origin discrimination of G. rhizoma collected from three different areas in China.
The chromatographic data for the twelve samples were processed by similarity analysis and HCA. From the results of the similarity analysis, we can find that the G. rhizoma samples have relatively constant quality, and the HPLC fingerprint method could be used in the quality control. Interestingly, the samples from three major origins of G. rhizoma have some differences. In addition, the results of HCA indicated the presence of a correlation between the major origin area of G. rhizoma samples and the types and quantities of chemical constituents.
Conclusion
HPLC fingerprint and origin discrimination method for G. rhizoma from three areas in China have been developed and established. The method and established model are efficient and accurate, and can be applied in the quality control and major origin area discrimination of G. rhizoma.
Declarations
Acknowledgement
References
Archives


News Updates